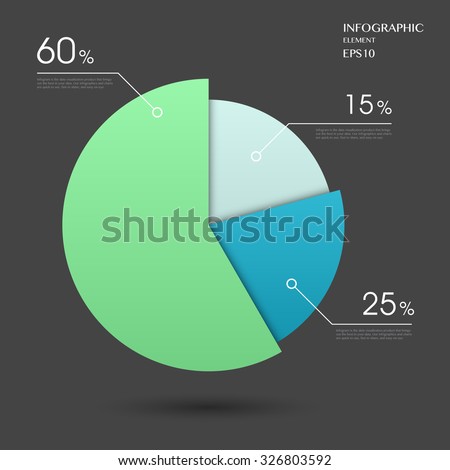
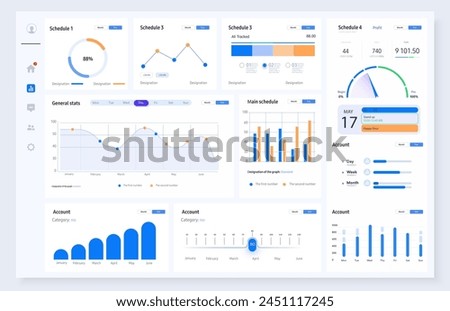
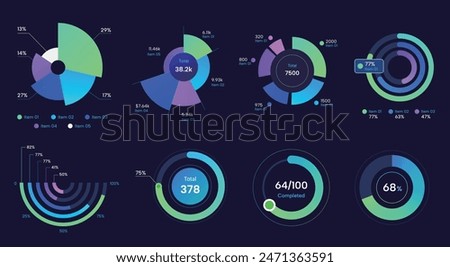
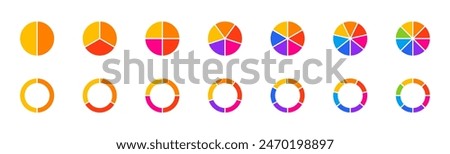
Graph pie vector icons download free

109 graph pie icons download SVG PNG. Professionally designed high quality vector icons download free

Sort by

Premium vectors from Shutterstock

People Infographics, gender pictographic vector for presentation and website Pie chart set from 50/50 to 100 percents ready to use for web design, user interface (UI) or infographic. Two colors - rose and blue Business data market elements dot bar pie charts diagrams and graphs flat icons set isolated vector illustration. modern vector abstract pie chart infographic elements.can be used for workflow layout, diagram, number options, web design.  illustration ,EPS10 Comprehensive Analytics Dashboard UI with Diverse Data Visualization. User interface of an analytics dashboard featuring a variety of graphs and charts for efficient data management and monitoring. Circles for infographics. Pie charts, diagrams with 3, 4, 5, 6, 7, 8 steps, options, arrows. Vector templates. Set of outline icons related to analysis, infographic, analytics. Editable stroke. Vector illustration. set of colorful dark cool pie chart, visual chart Pie chart infographic set. Circle diagram collection with sections or parts. Segmented circle icons for infographic, data analysis, web design, ui or presentation. Vector illustration. set of colorful cool pie chart on dark background. futuristic style trendy ring chart

Premium vectors from Shutterstock

Infographic Elements Pie chart set icon set of retro style green orange colorful gradient data visual pie chart new nostalgia futuristic diagram Charts and diagram icon set. Charts and graphs. Pie , Line , Candlestick Chart. Planning and visualization of statistics. Isolated 3d icons, objects on a transparent background Pie chart, percentage diagram or progress bar set from 0% to 100 % for infographic. Percentage circle graph isolated set. Loading indicator. Vector illustration. Statistics icon set. Containing data, web statistics, survey, prediction, presentation, cloud analysis and pie chart icons. Solid icon collection. 5 step Infographics Design Template, Chart diagram, Graph, Pie chart, workflow layout, squire diagram, report, Editable presentation design elements, Info graph Process diagram in white background set of colorful cool futuristic trendy sport data topic pie chart vector diagram Set of infographic circle chart, pies segmented with equal parts,  Wheels divided in eleven sections. Circle section graph, Pie chart round. Loading bar set diagram multicolored collection. Modern infographic template with statistics finance charts. Infographics dashboard. Admin panel interface with color charts, graphs on white background. Illustration flowchart and diagram and workflow Circle loading or circle progress collection. Set of circle percentage diagrams for infographics 0 10 20 30 40 50 60 70 80 90 100 percent in black and grey color. Vector infographics set.